


Economic commentary: „Crisis Cycle: Challenges, Evolution, and Future of the Euro“
In the 2025 publication „Crisis Cycle: Challenges, Evolution, and Future of the Euro“ by John Cochrane, Luis Garicano and Klaus Masuch, Chapter 9 is particularly interesting, as it is dedicated to inflation dynamics within the Eurozone.
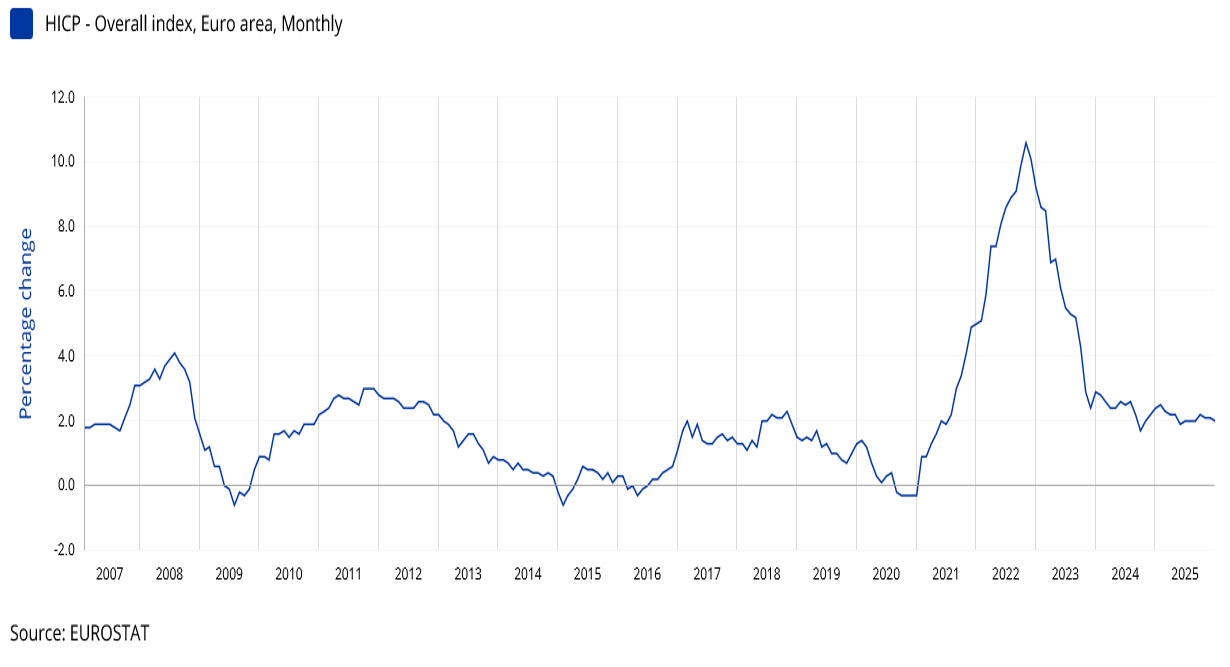
Inflation measured by the Harmonized Index of Consumer Prices (HICP) followed a conventional boom-and-bust cycle during the Global Financial Crisis, which began in 2008 and subsequently evolved into the Sovereign Debt Crisis (2010–2012), fluctuating within an amplitude of 4.1% to -0.6%. During the recovery from the Sovereign Debt Crisis from 2013 to 2016, inflation hovered near zero. It then rose to around 2% in the 2017–2018 period before beginning to decline again from 2019 onward.
The authors note that in January 2020, the European Central Bank (ECB) initiated a systematic policy review clearly aimed at raising inflation, which had been worryingly low for an extended period. However, these plans coincided with the onset of the pandemic crisis. Throughout 2020, inflation remained negative, only to begin rising sharply at the start of 2021.
The initial reaction of the ECB is well known. On one hand, the ECB kept its key policy interest rates unchanged at historically low levels, despite rising inflation. Based on the forecast that inflation was transitory, the ECB refrained from monetary tightening, even after the energy market disruptions at the end of February 2022. On the other hand, it continued its massive bond-purchasing programs and bank lending schemes.
However, as reality contradicted the forecasts, the ECB began raising its key interest rates in July 2022 and halted the bond-purchasing programs in September 2022. Inflation peaked at 10.6% in October 2022 before commencing a downward trajectory. The debate over the forecasting failures and the underlying drivers of the inflation surge remains ongoing. The authors argue that an analysis of the shocks’ nature is definitely needed so that institutions adhere to the appropriate monetary policy rules in future similar cases. Accordingly, their investigation focuses on the pandemic-induced supply shocks and, especially, on the role of fiscal shocks.
Namely, the foundations of the Fiscal Theory of the Price Level (FTPL) are established in two pivotal studies. The first is Leeper (1991), “Equilibria under ‘Active’ and ‘Passive’ Monetary and Fiscal Policies”. This paper provides the crucial regime framework. It demonstrates that the determinacy of the price level depends on the specific interrelationship between monetary and fiscal policy. The second foundation is Lucas & Stokey (1983) “Optimal Fiscal and Monetary Policy in an Economy without Capital” that explains the state-contingent debt and the time-consistency problem. It is very interesting that the authors liken the government’s temptation to inflate away the real value of its existing debt to Ulysses resisting the song of the Sirens in Homer’s Odyssey.
The authors want to say that despite the fact that supply shocks, energy shocks and pandemics have recently appeared, in fact this interrelationship between fiscal and monetary policy contributed to the appearance of inflation, that is, fiscal expansion and monetary accommodation. In short, the shocks provided the kindling, but the monetary-fiscal interrelationship provided the spark and determined the size of the fire.
Size of the central banks’ balance sheets
The authors highlight the significant expansion of the ECB’s balance sheet over time. At its peak in mid-2022, this expansion was primarily driven by bond purchases (encompassing both government and corporate debt) and by lending operations to commercial banks. On the liability side, bank deposits increased substantially, with a more moderate rise in currency in circulation. By mid-2024, the balance sheet had undergone a partial contraction, largely attributable to a reduction in bank lending. Nevertheless, a key structural concern persists: the substantial holdings of bonds acquired under the Asset Purchase Program (APP) during 2015–2017 and 2019, and under the Pandemic Emergency Purchase Program (PEPP).
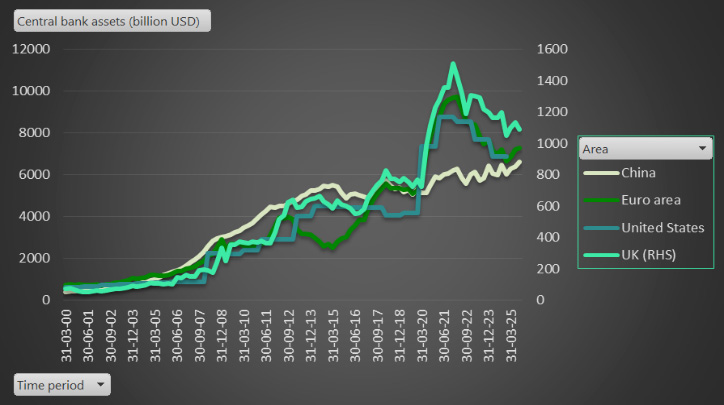
Motivated by these observations, I conducted a comparative analysis of the central bank balance sheets of the Eurozone and three systemically important economies – two current (the United States and China) and one historical hegemon (the United Kingdom). The comparison tracks two metrics over time: nominal value in billions of US dollars (Chart a) and size relative to GDP (Chart b). In Chart a), due to scale differences, the UK series is plotted against a secondary axis. The analysis reveals convergent trends in both the absolute and relative balance sheet measures for the Eurozone, the United States and the United Kingdom, in contrast to the divergent trajectory observed for China. Furthermore, the data indicate that the ECB’s balance sheet, in both nominal and GDP-adjusted terms, has remained the largest among the observed central banks since the pandemic crisis. This finding lends support to the authors’ warranted skepticism regarding the Eurozone’s policy options in a future crisis, which may be constrained to either forgoing large-scale interventions or undertaking them, a path that would inherently involve using inflation to erode the real value of accumulated debt.
(February, 2026)
Figure: Central bank assets over time
a) Central bank assets (billion USD)
b) Central bank assets to GDP
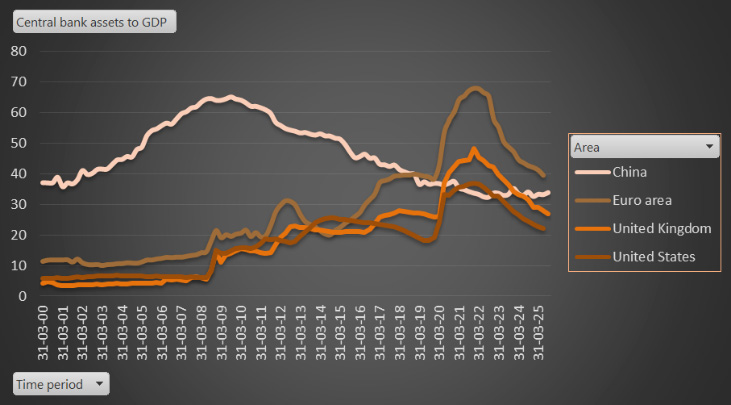
Source: Bank for International Settlements (BIS) data portal.